Urban sprawl picture shown at the Biennale of Venecia. Picture from the Biennale web page
It is not easy to analyze urban morphology with a case of Urban sprawl like this. I propose here some tools from image analysis softwares that are helpful when we do not have a grid or urban quadrille or any other recognizable form. The first step, and this is pretty much for all softwares is to convert the jpg image into a binary file.
A profile plot of the picture will show the division between urban sprawl and a standard urban pattern. The peaks will show the grey intensity. For the purposes of the exercise, I did not take the time to adjust the greys from the original image to accurately show the empty and fill areas. Anyway, a white area means empty, and we have the option to reverse it.
The depression is showing the freeway. On the left side of it, the peaks are pretty even, it means the urban sprawl is like a uniform shape in its complexity. On the right side, the buildings are not uniform.
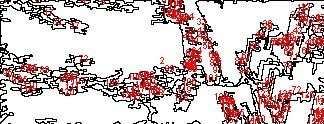
I can also count the particles. It is important to notice that the softwares conjoin particles that are very close, so if infinite particles are seen, it is not considered like this. Because when houses are touching each other, they will conform a conglomerate, we cannot count one by one any more. The red spelling are numbers with the account of particles.
The surface plot is a digital analysis of rugosity in 3D. Notice the difference on the buildings side.
The exercise above is a quick way to compare two different morphologies in the same regional area, or in the same city. If we are interested exclusively in the urban sprawl, we focus strictly in this area of the picture.
I remove the freeway and tall buildings and look for edges to find a definition of the form. The process begins again. If edges are shown, particles, plots of profile and surface will be different. That is why it is so important to select adequate filters. Adding noise is a good option to fill the emptiness, to a certain degree.
Do I find a structure here? Well, it is a fractal urban pattern with fractal dimension D=1.9396, when D is close to 2, the plane (space) is occupied almost completely. This is true for urban sprawl.
Is there any hidden structure? An analysis based on Fourier transform will confirm it.
This Fourier transform of the urban sprawl image tells us that there is no buildings or streets of particular interest, the urban morphology is absolutely uniform, it must be read as a conglomerate. This last image is also a fractal, with D=1.9862. The similar result to the previous image shows that the analysis of fractality, even in the analogy of the FFT image is correct.
All images of analysis by Myriam B. Mahiques.


No comments:
Post a Comment